> ## Documentation Index
> Fetch the complete documentation index at: https://docs.pastahr.com/llms.txt
> Use this file to discover all available pages before exploring further.
# Downloading a HAR Report
> How to create and download a HAR report when a process in PastaHR is slow or not working.
When a process in PastaHR is running slowly or not working as expected, a HAR report (HTTP Archive) helps us enormously with troubleshooting. The report records every network request your browser makes and shows us exactly where things are getting stuck.
## Step 1: Enable developer mode
If you have never used your browser's developer tools before, you just need to open them. In most cases a keyboard shortcut is all it takes, there is nothing to "enable" separately.
Press `F12` or `Cmd + Option + I` (Mac) or `Ctrl + Shift + I` (Windows). Alternatively, right-click the page and select **Inspect**.
Press `F12` or `Cmd + Option + I` (Mac) or `Ctrl + Shift + I` (Windows). Alternatively, right-click the page and select **Inspect**.
Press `F12` or `Ctrl + Shift + I`. Alternatively, right-click the page and select **Inspect**.
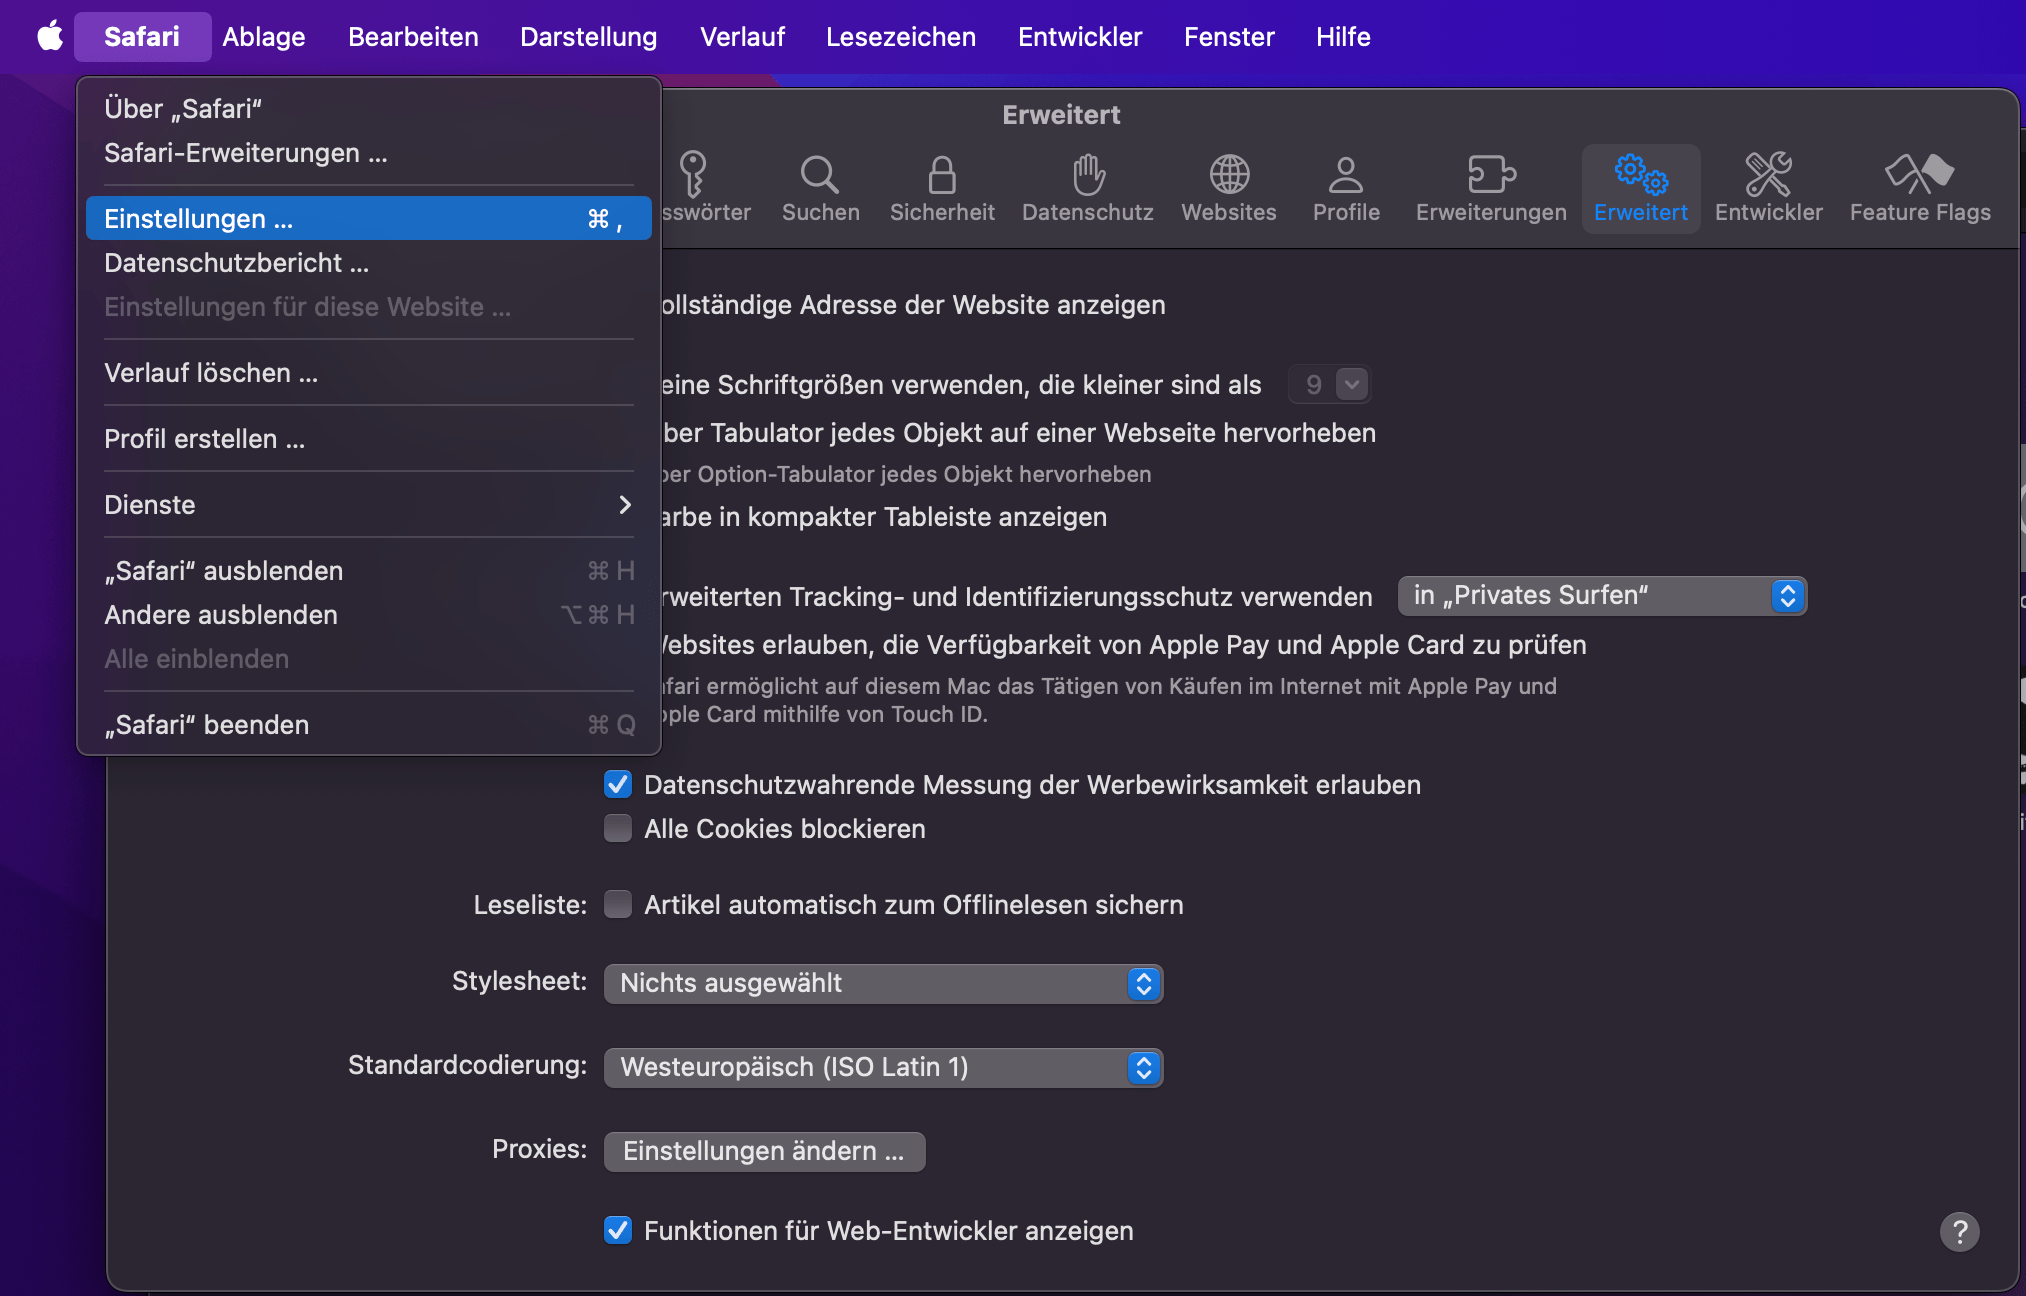
First open **Safari**, then **Settings**, then **Advanced**, and enable **Show features for web developers**. You'll then find the **Developer** menu at the top, then **Show Web Inspector** (`Cmd + Option + I`). (Tick the checkbox at the bottom.)
 ## Step 2: Open the Network tab and start recording
In the developer tools, switch to the **Network** tab.
Clear the list before you start the process. Click the no-entry icon (a circle with a diagonal line) at the top left of the panel, or use the shortcut `Cmd + K` (Mac) or `Ctrl + L` (Windows). This way, the report will only contain the requests related to your issue.
Make sure recording is running. It's usually active by default, shown by a red dot or circle at the top left of the panel. If it's paused, click the icon to start it.
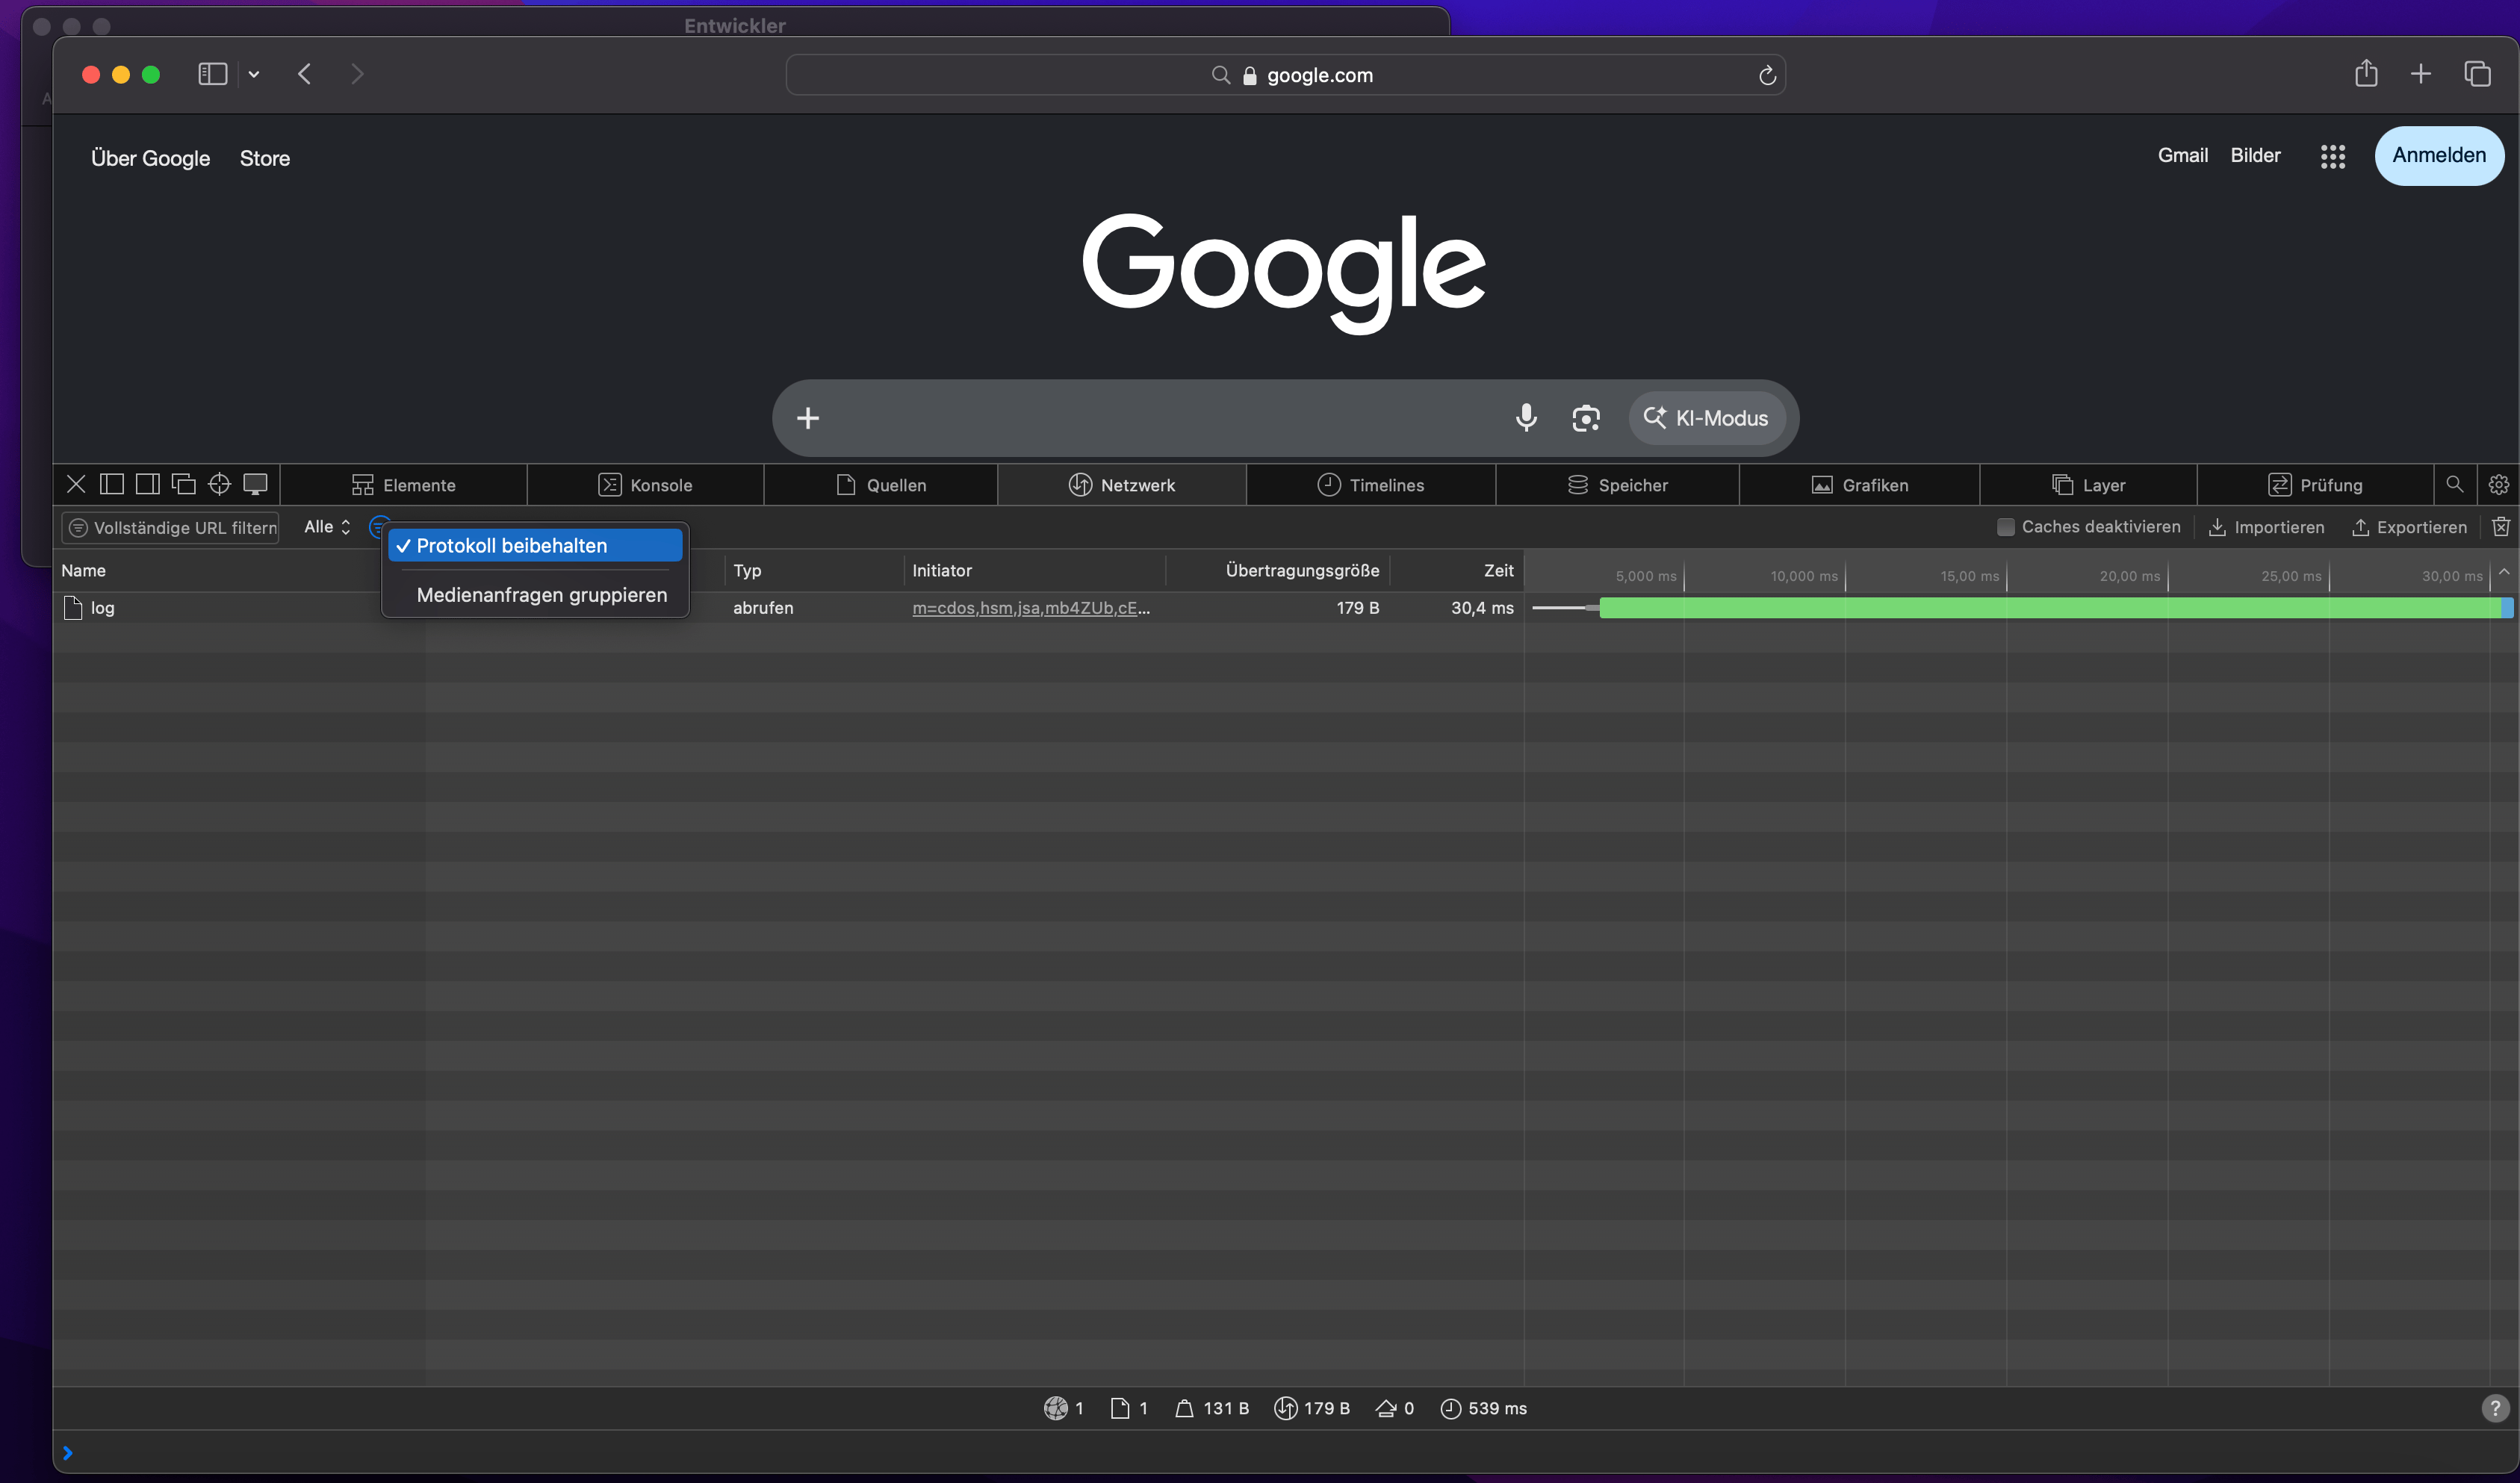
Also enable the **Preserve log** option. This keeps all requests visible even if the page reloads in the meantime.
## Step 2: Open the Network tab and start recording
In the developer tools, switch to the **Network** tab.
Clear the list before you start the process. Click the no-entry icon (a circle with a diagonal line) at the top left of the panel, or use the shortcut `Cmd + K` (Mac) or `Ctrl + L` (Windows). This way, the report will only contain the requests related to your issue.
Make sure recording is running. It's usually active by default, shown by a red dot or circle at the top left of the panel. If it's paused, click the icon to start it.
Also enable the **Preserve log** option. This keeps all requests visible even if the page reloads in the meantime.
 ## Step 3: Reproduce the affected process in PastaHR
Now navigate to exactly the process that is slow or not working, while the network recording is running. For example:
* Open the application flow where it's stuck
* Load the applications overview that responds slowly
* Trigger an action that shows an error (e.g. "Resend" on an application)
Reproduce the process the way it normally happens, including the point where the problem occurs. The more precisely you reproduce the issue, the easier it is for us to follow it in the report.
## Step 4: Export the HAR file
Once the process has run through (or the error has occurred), you can export the recorded data.
Right-click any request in the list, then select **Save all as HAR with content**. Save the file somewhere you'll find it again.
Click the gear icon at the top right of the Network panel, then select **Save All As HAR**.
Right-click any request in the list, then select **Save all as HAR with content**.
In the Network tab, click the export icon (a down arrow) at the top of the panel and save the file.
The file is saved as a `.har` file, usually to your Downloads folder by default.
## Step 5: Send us the HAR report
Send the `.har` file along with a short description to our support team:
* What were you trying to do?
* What happened instead (slow, error message, no response at all)?
* What time did it happen?
With these details, we can identify and fix the problem much faster.
If you're seeing several different issues, create a separate HAR report for each one. This makes it much easier for us to match reports to problems.
## Step 3: Reproduce the affected process in PastaHR
Now navigate to exactly the process that is slow or not working, while the network recording is running. For example:
* Open the application flow where it's stuck
* Load the applications overview that responds slowly
* Trigger an action that shows an error (e.g. "Resend" on an application)
Reproduce the process the way it normally happens, including the point where the problem occurs. The more precisely you reproduce the issue, the easier it is for us to follow it in the report.
## Step 4: Export the HAR file
Once the process has run through (or the error has occurred), you can export the recorded data.
Right-click any request in the list, then select **Save all as HAR with content**. Save the file somewhere you'll find it again.
Click the gear icon at the top right of the Network panel, then select **Save All As HAR**.
Right-click any request in the list, then select **Save all as HAR with content**.
In the Network tab, click the export icon (a down arrow) at the top of the panel and save the file.
The file is saved as a `.har` file, usually to your Downloads folder by default.
## Step 5: Send us the HAR report
Send the `.har` file along with a short description to our support team:
* What were you trying to do?
* What happened instead (slow, error message, no response at all)?
* What time did it happen?
With these details, we can identify and fix the problem much faster.
If you're seeing several different issues, create a separate HAR report for each one. This makes it much easier for us to match reports to problems.